 Asians and Pacific Islanders represent 5.7% of the general population but make-up 6.6% of all undergraduates. There are two to four times more Asians at the most competitive schools than in the general population. Asian students make up 21% of undergraduates at Stanford and 19% at Harvard. Because of this “over-representation” and general “model minority” myth, Asian students are often perceived as doing well no matter where they attend school.
Part of the problem is that Asian-Pacific Islander designation represents an aggregation of subgroups with very different levels of education attainment. The percentage of these subgroups with a Bachelor’s degree or higher ranges from a low of 14.7% to a high of 74.1%.
Join other parents in the Coffee Cup College Planning Facebook Group
Accusations of Discrimination
It’s likely that those in the groups with higher education attainment disproportionately apply to the nation’s most elite universities. Many of these applicants feel they are being held to a different standard for admissions because of their higher achievement. In order to keep a minimum number of positions available for non-Asians, they believe that have to have even higher qualifications. CNN reports that the Students for Fair Admissions have filed a lawsuit against Harvard alleging Harvard sets Asian-American caps.
Princeton sociologist Thomas Espenshade showed in his research that with all other quantifiable variables equal, Asian-Americans needed to score 140 points higher than white students to be admitted into elite schools. However, the analysis didn’t include “‘softer variables,’ such as teacher and high school counselor recommendations, essays, and lists of extracurricular activities. ”
Model Minority?
Among 50-50 schools the “model minority” myth doesn’t hold up as well. There are certainly elements of it given that of the 429 college reporting six-year graduation rates for Asian and Pacific Islanders, 24 had 100% graduation rates for the group. Yet, these were based on small populations with Asian-Pacific Islander students consisting of only 0.6% to 5.2% of the full-time undergraduate population.
Part of the model minority myth would suggest that Asians have a higher graduation rate than the general graduation rate. However, among 50-50 schools, 199 had lower Asian graduation rates than the general population with the difference being ten points or greater at 104 of the schools. There are 225 50-50 colleges where the Asian graduation rate was higher than the general rate and 85 of these schools had a differences of ten points or more between the two rates.
Colleges with Highest Graduation Rates for Asian Students
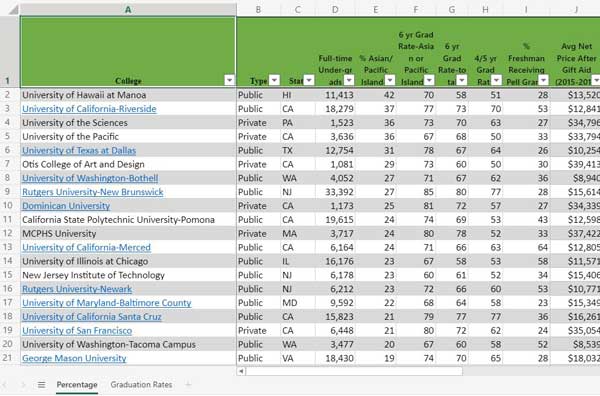
The table below shows the 50-50 schools with the highest percentage of Asian-Pacific Islanders and those with the highest graduation rate for Asian-Pacific Islanders. A total of 111 schools had six-year graduation rates for Asian-Pacific Islanders of 80% or better. Sixteen schools appear on both lists.
Highest Percentage of Asian Students
There are 50 schools where Asian-Pacific Islanders make-up ten percent or more of the full-time undergraduate population. California has the most 50-50 colleges with the highest percentage of Asians with a total of 14. New Jersey and New York tie for second with five each followed by Pennsylvania and Washington with four each.
I included the six-year rate for comparison purposes. As usual, I use the four-year rate for private schools and the five-year rate for public.
50-50 Colleges for Asian Students
CONNECT WITH OTHER PARENTS PLANNING FOR COLLEGE
JOIN THE COFFEE CUP COLLEGE PLANNING FACEBOOK GROUP


1 thought on “50-50 Highlights: Colleges for Asian Students”