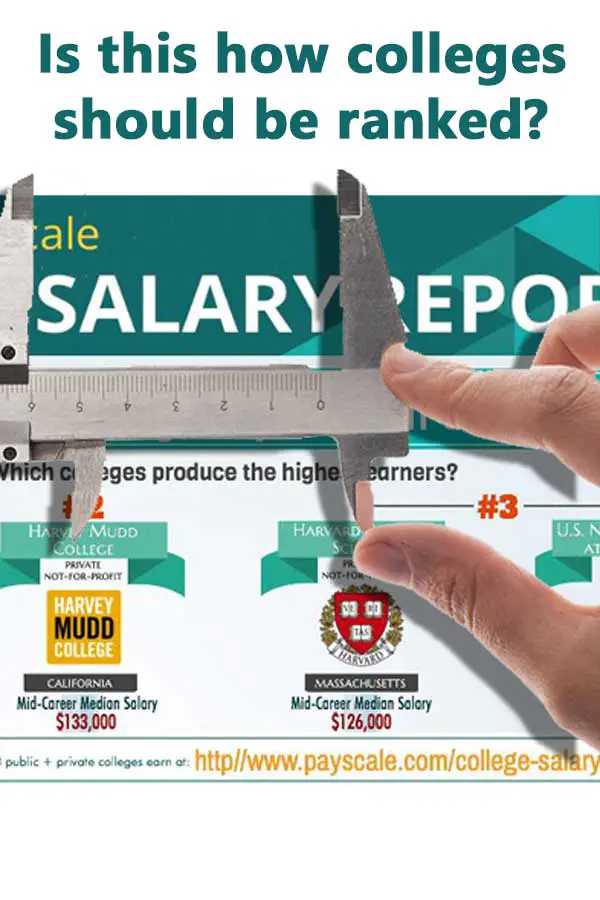
 Another week and another set of college rankings-must be back to school time. This week PayScale released its College Salary Report. As far as rankings go, it has several features to recommend it. The primary advantage is that it really is exclusively focused on outcomes. No national reputation score, no attempts to measure the qualities of the students. It’s strictly based on income of graduates.
Simple, right?
Not exactly. There are some problems with the approach and the data. You could make the argument that the rankings really just show which schools produce the most engineering graduates who submit their data to PayScale (Yes, I know this isn’t true). At least PayScale acknowledges this by including the percentage of STEM majors for each school.
Then there’s the problem that the rankings are based on self-reported data. PayScale acknowledges that this means larger schools are more likely to appear in the database and that the confidence intervals vary according to the size of the school.
There are all kind of issues with the data used in the PayScale College Salary Rankings, some of which I discussed in the Money rankings which also used PayScale information. But the advantage of the PayScale rankings is its transparency about its methodology and data. There’s no survey of human resource managers about the quality of the graduates from specific colleges to ensure the schools at the top of the list stay there year after year.
If they don’t have enough graduates from a school to calculate an average, they don’t include the school. And they explicitly state that “A school’s inclusion in or exclusion from the PayScale College Salary Report 2015-16 is not based on school quality, typical graduate earnings, selectivity, or location within the U.S.”
And there are a lot of schools that aren’t included. Of the over 1,600 public and private schools with 500 or more full-time undergraduates, 41% are not included in the rankings. PayScale includes only half of colleges with less than 5,000 undergraduates and approximately 60% of colleges with less than 2,500 are missing from the rankings.
Therefore, even though with focus on outcomes and the data and methodology transparency, the PayScale College Salary Rankings are of limited use when deciding which college to attend.
So why am I even writing about the PayScale rankings? Because this is exactly the kind of data that should be available but isn’t because of opposition by colleges. Just this summer, the Obama administration backed off creating a rating system that included “how many of their students graduate, how much debt their students accumulate and how much money their students earn after graduating.”
Instead, the Education Department is going to give students and families the ability to sort and compare colleges themselves. While officials would like to include data on outcomes, the Washington Post reports that “College officials, though, are ambivalent about publication of such data.” No kidding.
Until recently, the federal government really was the only viable source of such data and it was pretty easy for colleges to keep it from becoming public and being used in “inappropriate” ways. But now there’s another source of data, PayScale, and they’ve decided to make the information public regardless of how inappropriately it might be used. (I do think they have done a reasonable job with the data they have.)
Soon colleges will have to address why their salaries are low or why they aren’t available at all. Maybe it will result in colleges deciding to collect and release outcomes data that does a better job of accounting for the differences between colleges. If they don’t, obviously someone else will–go PayScale!
Therefore, despite the limitations of the rankings, I’m listing below the 50-50 colleges that are in the top 100 of PayScale’s Bachelor’s Only list. I don’t think the value is in the actual rankings but rather in understanding why some schools are on the list and other aren’t.
Only 22 50-50 schools made the list. However, nearly a quarter of the 50-50 schools are not included in the rankings because of the lack of data. Not surprising, most of these had less than 2,500 full-time undergraduates.
Of the 22 in the top 100, 9 had a high percentage of engineering graduates with six over 50%. However, eight of the schools had 10% or fewer of graduates with engineering degrees. The five colleges with less than 2,500 full-time undergraduates included an engineering college and a Maritime Academy. As usual, the four-year graduate rate is used for private schools and the five-year rate for public.
50-50 Colleges in Top 100 of PayScale’s Bachelor’s Only Rankings
(Download PDF version)
| PayScale Ranking | Name | Type | State | Full- time Under- grads | 4/5 yr Grad Rate | Avg Net Price After Gift Aid (2012-2013) |
|---|---|---|---|---|---|---|
| 21 | Santa Clara University | Private | CA | 5338 | 77 | 38844 |
| 22 | Manhattan College | Private | NY | 3195 | 60 | 26151 |
| 22 | Worcester Polytechnic Institute | Private | MA | 3959 | 70 | 37192 |
| 22 | Georgia Institute of Technology-Main Campus | Public | GA | 13291 | 76 | 11864 |
| 26 | Clarkson University | Private | NY | 3084 | 61 | 25782 |
| 35 | Massachusetts Maritime Academy | Public | MA | 1333 | 64 | 13791 |
| 38 | Rose-Hulman Institute of Technology | Private | IN | 2186 | 66 | 36613 |
| 49 | Reed College | Private | OR | 1356 | 70 | 19424 |
| 52 | Loyola University Maryland | Private | MD | 3951 | 79 | 31306 |
| 52 | Missouri University of Science and Technology | Public | MO | 5472 | 56 | 15191 |
| 52 | Hofstra University | Private | NY | 6378 | 50 | 30947 |
| 59 | Whitman College | Private | WA | 1505 | 80 | 34363 |
| 59 | Saint Mary's College of California | Private | CA | 2823 | 50 | 33206 |
| 59 | Villanova University | Private | PA | 6547 | 86 | 30587 |
| 66 | Michigan Technological University | Public | MI | 5198 | 58 | 15434 |
| 72 | Texas A & M University-College Station | Public | TX | 39641 | 75 | 11323 |
| 75 | University of Illinois at Urbana-Champaign | Public | IL | 31516 | 82 | 16490 |
| 84 | Wagner College | Private | NY | 1765 | 53 | 27470 |
| 86 | Virginia Polytechnic Institute and State University | Public | VA | 23512 | 80 | 19096 |
| 89 | Loyola Marymount University | Private | CA | 5935 | 67 | 36650 |
| 93 | Wentworth Institute of Technology | Private | MA | 3634 | 50 | 31829 |
| 98 | Rutgers University-New Brunswick | Public | NJ | 31759 | 76 | 16040 |


1 thought on “50-50 Highlights: Colleges in the Top 100 of PayScale College Salary Rankings”