 Troy Onink used to provide a Federal FAFSA EFC Chart until he passed away in 2018. His chart is still probably one of the most commonly found on the internet even though it’s from 2017-18. It’s still useful for its shock value. Most parents have little sense of what college is going to cost and the EFC chart is a wake-up call. Hopefully, parents who see it today will be motivated to use an EFC calculator to get an estimate for their own situation. In any case, since the table is outdated, I’ve created my own EFC chart.
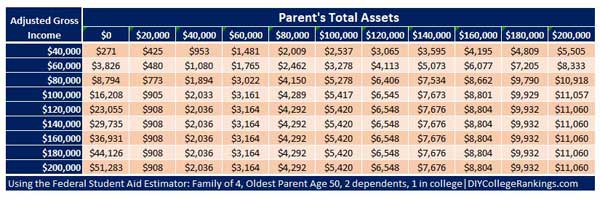
The first thing to know about the 2022-23 EFC chart is that I didn’t create it to be used as a way to estimate your EFC. You REALLY need to use an EFC calculator as soon as possible. The numbers in the table are the results from using the Federal Student Aid Estimator for a family of four, with 50 being the age of the older parent, and only one child in college. If that’s your situation, maybe it can give you some idea of what to expect. But I’ll say it again, use an EFC calculator!
Why THIS financial aid EFC chart
I created this EFC Chart so that families can see how much savings affect financial aid. One comment I hear frequently is that “we’re not saving so we can qualify for more financial aid.” I have to admit, that I don’t really believe them. In most cases, I think it’s just an excuse for spending the money on something else other than saving. Nonetheless, I’m giving them the benefit of the doubt and taking the time to create this table so people can see how financial aid works.
How EFC works
College financial aid generally begins with the FAFSA which students submit to the federal government. The government uses the information to generate an Expected Family Contribution (EFC) which is the number used to qualify for Pell Grants. (This is being transitioned to the Student Aid Index (SAI) so maybe I should be calling this the SAI Chart.) The bulk of federal aid is basically Pell Grants and Direct Student Loans. Anything more generally comes from the colleges. Higher education institutions use the EFC to award grants and scholarships from their own funds.
The way it’s supposed to work is Total Cost of Attendance-EFC=financial need. For example:
| College Cost: | $50,000 |
| – EFC: | $20,000 |
| = Financial Need: | $30,000 |
There’s a lot more to it than just this but the critical part to understand at this point is that your EFC (or SAI) is the basis of your financial aid. Therefore, obviously, the lower your EFC, the better. Which brings us to people claiming that they aren’t saving for college so they can increase their financial aid awards. So let’s just start with the EFC Chart.
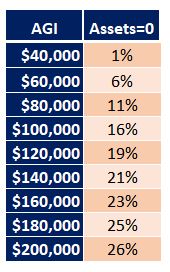
As you can see from the first column, as your income increases so does your EFC. The percentage of the Adjusted Gross Income (AGI) increases as well. The following table shows the EFC as the percentage of income.

The remaining columns list the EFC for the AGI income based on an increase in Parental Assets, which includes savings. Given the $40,000 AGI row, it looks like those worried about saving might be on to something since the EFC doubles when your assets increase by $20,000 and quadruples when you increase it to $40,000. But remember, you’re starting from a low base. The same thing doesn’t happen at higher income levels.
Maybe you would be better off quitting your job
Consider looking at the table a different way. At the 0 assets level, the EFC chart shows that the EFC increases from $271 at the $40,000 level to $3,555 at the $60,000 level. How much would your assets have to increase at the $40,000 to reach the level caused by an increase in income? The family would have to have $120,000 in assets at the $40,000 level to match the results of a $20,000 increase in income.
Let’s see, by the logic of those avoiding savings, maybe parents should just quit their jobs, or at the very least, take a lower paying one, given the advantage of saving over working. Of course, it’s hard to save if you aren’t working so that may not be a viable strategy.
The reality is that the EFC (SAI) formula assesses assets at a much lower rate than income. The following table shows how much more is added to your based EFC depending on your assets. If your AGI is $100,000, then you potentially “lose” $905 in financial aid if you have $20,000 in assets or $11,057 if you have $200,000 in assets. Compare that to the just under $7,000 you “lose” in aid if you add $20,000 to your income.

Furthermore, while your EFC increases as a percentage of your income as your income increases, the same is not true of your assets. On the EFC chart, once you reach $120,000, the additional amount added to your EFC because of your assets stays the same. The percentage doesn’t increase. The EFC calculations may be asking for 26% of your income but your assets are still assessed at just 5.5%.
I’m sure this comes as a shock to the saving avoiders. After all, they are under the impression that the EFC is coming for everything you own, not just everything you earn. It turns out that earning a lot and saving just a little isn’t the key to more financial aid.
High EFCs mean that it’s easier for schools to meet your need
And before people start complaining that only the poor get financial aid, please don’t. (Read: 3 Hard Truths About Who Gets Financial Aid.) Just because they have high financial need doesn’t mean they are going to get the financial aid required to attend college. That’s because only around 80 schools claim to meet full financial need and these are among the most competitive schools in the country. Remember, the federal government’s contribution of free money is pretty much limited to a Pell Grant. This country relies on the colleges to provide students with needed financial aid.
Need-based financial aid
Now take a moment to think this through. Say, a private college costs $70,000. Yes, at least 120 colleges have a total cost of attendance over $70,000. It can either give one student with a $6,000 EFC $64,000 (Download List of Best Bet Colleges for EFC=0) or two students with $30,000 EFCs, $32,000 expecting their families to somehow come up with the extra $8,000. In the latter case, the school is at least bringing in some money. The fact is that it’s easier to meet financial need for students with higher EFCs than lower. And it’s as good an explanation as any for why schools that meet full financial need don’t come close to having their student population reflecting the economic distribution of society as a whole.
Merit-based financial aid
Furthermore, this financial aid for higher income students is often labeled as merit scholarships. Let’s go back to the students with $30,000 EFC. If they are willing to attend a less prominent school which charges less, they may find they qualify for a $30,000 merit scholarship instead of any official need-based grants. The problem is that while the students and/or the parents may feel good about the size of the “scholarship,” they often require a higher GPA to maintain the scholarship. Most have reasonable GPAs but some are high enough that you can’t help but think that the scholarship money will be free the following year to get some other freshman to attend.
 The take-away from this is that few colleges can meet financial need so families will be “gapped” in financial aid awards. Your EFC isn’t the maximum that you’ll pay for college but the minimum.
College financial aid is complicated
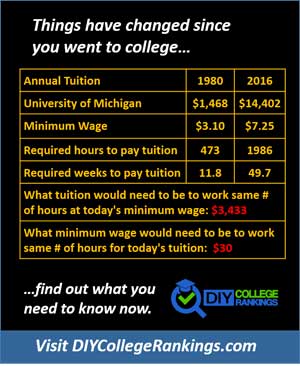
There is much more to financial aid than what I’ve covered here. There’s the details which include schools that also use the PROFILE financial aid form and net price calculators. Then there are the big issues that probably won’t be solved by the time your teen graduates from college such as why does college cost so much? Yeah, I don’t think I’ll be covering that here. Just keep in mind that it wasn’t always this way. I’m sure most people can come up with a variety of factors that have contributed to the out-of-control costs. Regardless of which issue you want to blame, the only people who have an incentive to change the system, or at the very least choose not to participate, are the students and parents. Until enough make their contributions to change the system, you’re stuck with the EFC.


4 thoughts on “The EFC Chart: Understand How Much You’ll Pay for College”