An overview of the following process is described in “And what about graduation rates.” These basic steps can be used for researching a variety of college characteristics. Or you can save yourself some time with the DIY College Search Spreadsheet instead.
Goal: Create a target group of colleges that graduate that meet the following requirements
- 50% or better graduation rate
- Accepts at least 80% of its applicants
- has at least 400 fulltime undergraduate enrollment
Other considerations:
Private schools graduation rate will be based on four years and public schools will be based on five years.
The final data set which we’ll call the target group, must show the following for each institution:
- State located in
- Total fulltime undergraduate enrollment
- Graduation rates
- Web address
This demonstration uses the Firefox browser and MS Excel 2007.
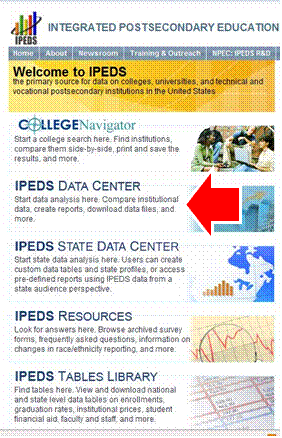 Go to the IPEDS website (http://nces.ed.gov/ipeds). Go to the IPEDS website (http://nces.ed.gov/ipeds).Select the IPEDS State Data Center. |
|
|
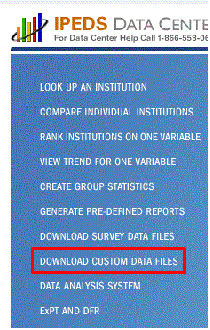 Next select the “Download Custom Data Files” option. |
|
|
Select “Continue”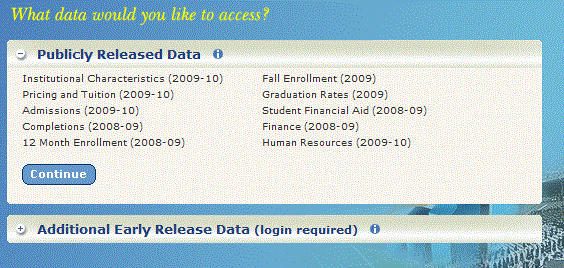 |
|
|
We aren’t looking for a specific institution but want all that meet our requirements. So click on the select button by the institution fields without entering anything in the field. It will look like nothing is happening.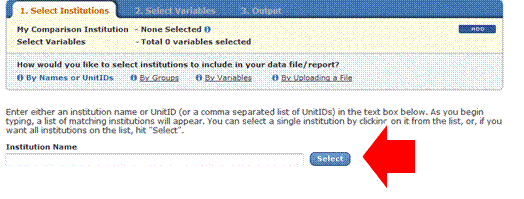 |
|
|
Hover over the “By Variables” option to open the tab. Then select “Browse/Search Variables”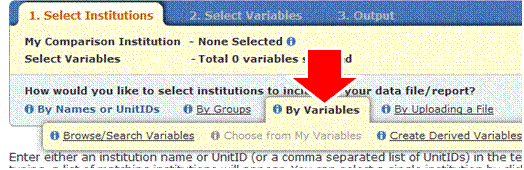 |
|
|
 Since we’re about to select data for comparisons, there are a few things to be aware of. First is that the most recent data showing on the College Navigator Site may not be available here at this time. So your graduation rate won’t necessarily match that from the College Navigator site because they are from two different years.You should also know that people who use the data for statistical analysis are much more careful in comparing variables from different surveys. However, since we’re just trying to develop a target group of colleges to start a college search, we won’t worry so much about such issues. We may miss some schools but they are likely to turn up in future searches or when we start our more subjective searches. Since we’re about to select data for comparisons, there are a few things to be aware of. First is that the most recent data showing on the College Navigator Site may not be available here at this time. So your graduation rate won’t necessarily match that from the College Navigator site because they are from two different years.You should also know that people who use the data for statistical analysis are much more careful in comparing variables from different surveys. However, since we’re just trying to develop a target group of colleges to start a college search, we won’t worry so much about such issues. We may miss some schools but they are likely to turn up in future searches or when we start our more subjective searches. |
|
|
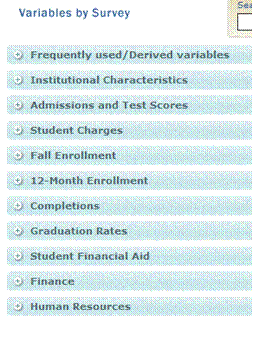
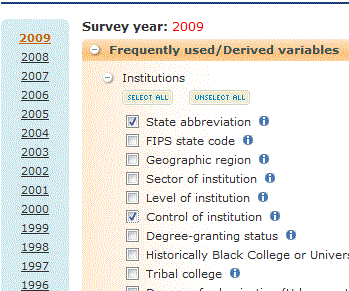
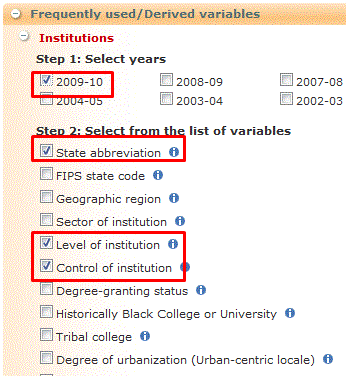 You select variables by clicking on the plus sign for the category.Select the “Frequently used/Derived variables” and then “Institutions.” Check “2009-10” for the years and then “state abbreviation”, “level of institution”, and ‘control of institution.”If you click on the blue circle with an “i” by the variable, it will explain the options for the variable. We want only four year institutions which is why we need “level of institution.” We check “control of institution” so we’ll be able to separate private schools from public schools. You select variables by clicking on the plus sign for the category.Select the “Frequently used/Derived variables” and then “Institutions.” Check “2009-10” for the years and then “state abbreviation”, “level of institution”, and ‘control of institution.”If you click on the blue circle with an “i” by the variable, it will explain the options for the variable. We want only four year institutions which is why we need “level of institution.” We check “control of institution” so we’ll be able to separate private schools from public schools. |
|
|
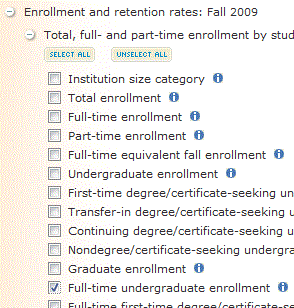
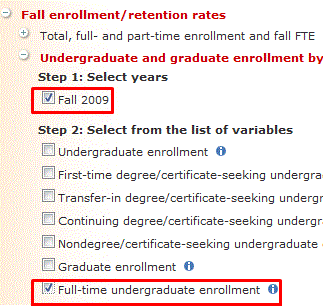 We also want some idea of how big the school is or isn’t. Next select “Fall enrollment/retention rates” and then “Undergraduate and graduate enrollment by full- and part-time status .” Check the “Fall 2009” box and the “Full-time undergraduate enrollment.” We also want some idea of how big the school is or isn’t. Next select “Fall enrollment/retention rates” and then “Undergraduate and graduate enrollment by full- and part-time status .” Check the “Fall 2009” box and the “Full-time undergraduate enrollment.” |
|
|
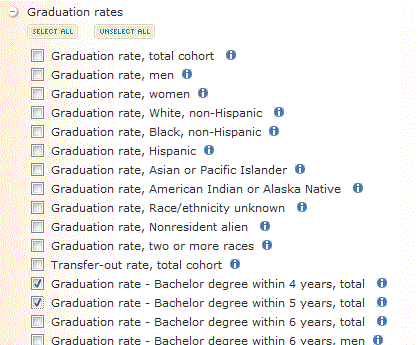
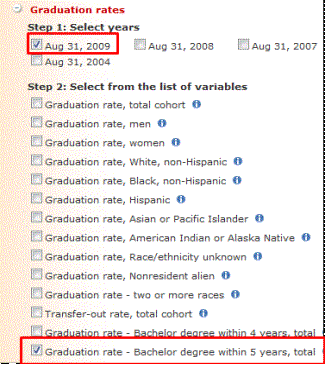 We want only schools with a 50% or better graduation rate in our target group. Select “Graduation rates” and check “Aug 31,2009” under years. Then check “Graduation rate-Bachelor degree within 5 years-total” We want only schools with a 50% or better graduation rate in our target group. Select “Graduation rates” and check “Aug 31,2009” under years. Then check “Graduation rate-Bachelor degree within 5 years-total” |
|
|
When making your selections, you should see the following menu floating at the top of your browser window as you scroll down the page. We’re done selecting variables so it’s time to click on “Continue” from this form.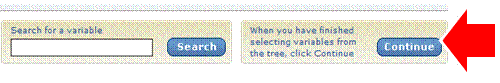 |
|
|
The next screen will show you a summary of the variables you have selected. Let’s assumed that we haven’t made a mistake and click the “continue” button.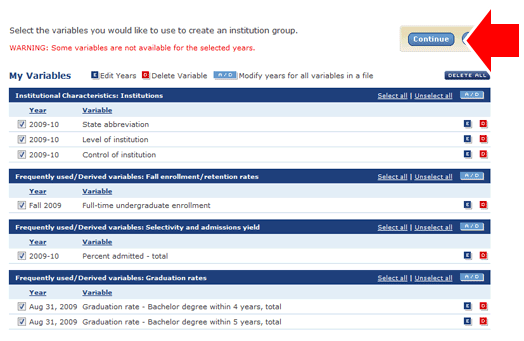 |
|
|
 You should now see another list of the variables selected. We will now click on the variables and enter our requirements, often referred to as search parameters, to narrow our list of institutions to our target group. You should now see another list of the variables selected. We will now click on the variables and enter our requirements, often referred to as search parameters, to narrow our list of institutions to our target group. |
|
|
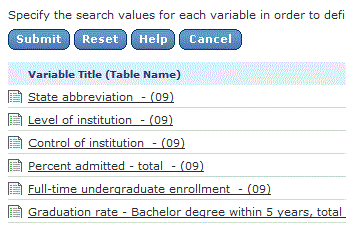
Start by clicking on the “State abbreviation” link. We want to limit our target group to just colleges in the United States. Click on the “select all” option. Then scroll down to the end of the state listing and uncheck all the options that are not states. When you are done, click the blue “save” button. You should now see the number of values (51) selected appear next to the “State abbreviation” link.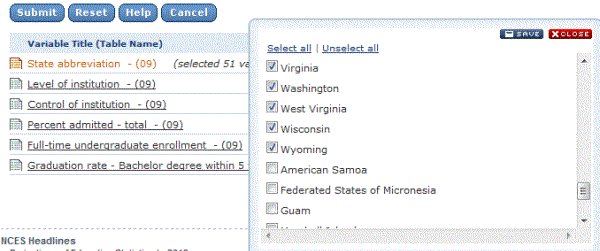 |
|
|
We want only four year institutions in our target group. For “Level of institution” select “Four or more years” and then save.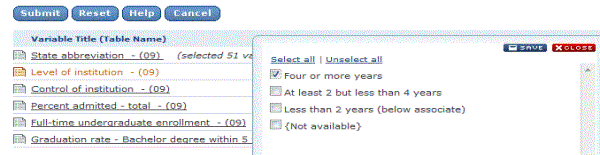 |
|
|
We don’t want to include for profit colleges in our target group. Select “Public” and “Private not-for-profit” for “Control of institution” and click “save.”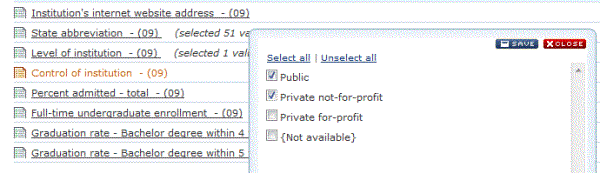 |
|
|
We’re looking for schools that admit 80% or more of their applicants. We could just us the greater than/equal sign and enter “80.” However, by using just the greater than and entering “79” we include schools that were really close to the 80 percent and should probably be considered. Select the mathematical sign, enter the number, and select “save.”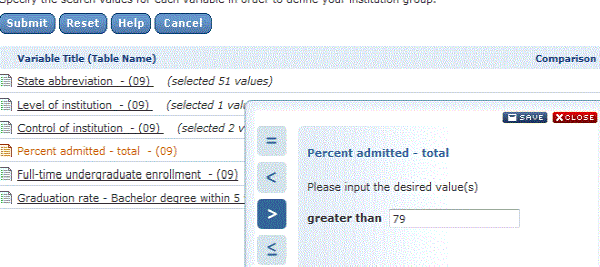 |
|
|
We want to eliminate as many specialty schools as possible so we’re only going to include a college if it has 400 or more undergraduates enrolled fulltime. Select the greater than/equal to option and 400 click “save.”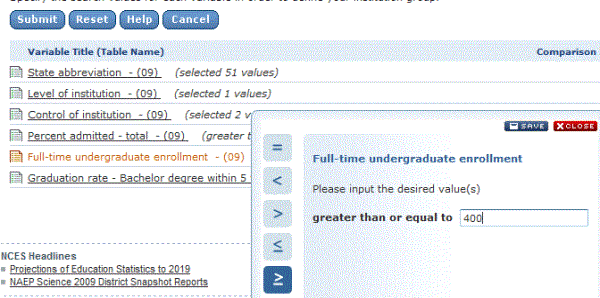 |
|
|
We want only schools with a graduation rate of 50% or higher. We’re using the 5 year rate at this point since the group we’re selecting includes both private and public schools. Once we have our data, we’ll eliminate any private schools with a four-year rate of less than 50%.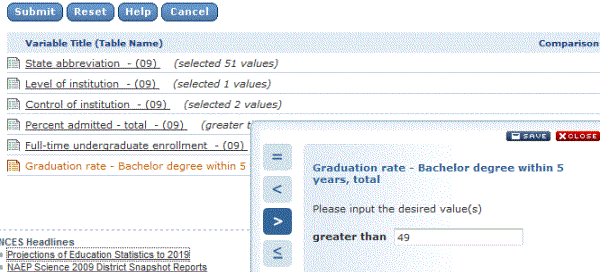 |
|
We’ve enter all of our search criteria so click the blue “Submit” button.
|
|
|
This screen shows all the institutions that meet our requirements. This puts our target group at 107 colleges. Click the blue “Continue” button in the center to go to the next step.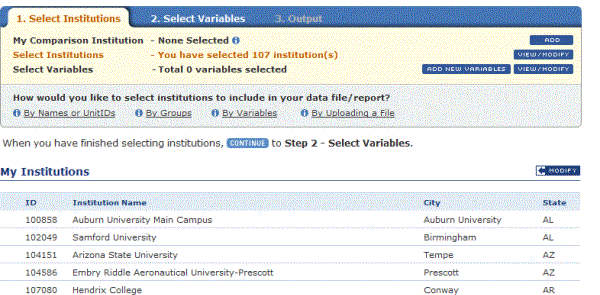 |
|
|
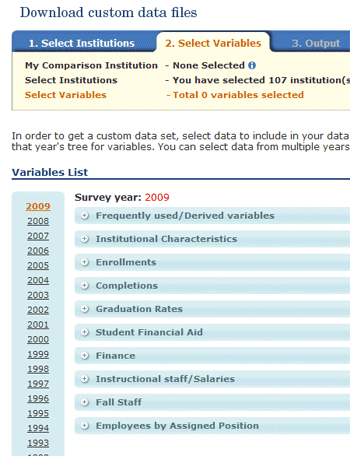 You might look at the “Select Variables” tab and be a bit confused. After all, you just selected a bunch of variables-right? You did but those were to define the colleges to put into our target group. Now you get to pick which variables you want to display for the target group. For example, we didn’t use any financial aid variables to define our group but we can pick them to display for the institutions we picked. If available, you can even pick data from years other than the one we picked, 2009.We also don’t need to include certain variables such as institution level. All the colleges in the target group or four years or more so it doesn’t provide any additional information to distinguish the colleges from each other. We also aren’t going to pick admissions percentage since we don’t care if a school has an 80% admissions rate or a 90% admissions rate. You might look at the “Select Variables” tab and be a bit confused. After all, you just selected a bunch of variables-right? You did but those were to define the colleges to put into our target group. Now you get to pick which variables you want to display for the target group. For example, we didn’t use any financial aid variables to define our group but we can pick them to display for the institutions we picked. If available, you can even pick data from years other than the one we picked, 2009.We also don’t need to include certain variables such as institution level. All the colleges in the target group or four years or more so it doesn’t provide any additional information to distinguish the colleges from each other. We also aren’t going to pick admissions percentage since we don’t care if a school has an 80% admissions rate or a 90% admissions rate. |
|
|
 We want to know what states the colleges are in and if they are private or public. Select “Frequently used/Derived variables,” then “Institutions”, and then check the “State abbreviation” and “Control of the institution.” We want to know what states the colleges are in and if they are private or public. Select “Frequently used/Derived variables,” then “Institutions”, and then check the “State abbreviation” and “Control of the institution.” |
|
|
 We want to have some idea of how big the school is select “Enrollment and retention rates: Fall 2009” and “Total, full-and part-time enrollment by student.” Then check “Full-time undergraduate enrollment.” We want to have some idea of how big the school is select “Enrollment and retention rates: Fall 2009” and “Total, full-and part-time enrollment by student.” Then check “Full-time undergraduate enrollment.” |
|
|
 We are going to want to eliminate private schools that have a four-year graduation rate of less than 50% so you’ll need to click on “Graduation rates” and then check “Graduation rate-Bachelor degree within 4 years, total.” Theoretically, we don’t need the five-year rate since all the schools in the target group have a 50% or higher graduation rate. However, I think it’s useful to know the gap between the four and five-year rates so go ahead and check “Graduation rate-Bachelor degree within 5 years, total.” We are going to want to eliminate private schools that have a four-year graduation rate of less than 50% so you’ll need to click on “Graduation rates” and then check “Graduation rate-Bachelor degree within 4 years, total.” Theoretically, we don’t need the five-year rate since all the schools in the target group have a 50% or higher graduation rate. However, I think it’s useful to know the gap between the four and five-year rates so go ahead and check “Graduation rate-Bachelor degree within 5 years, total.” |
|
|
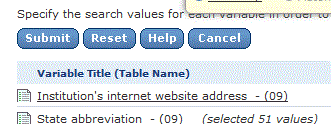
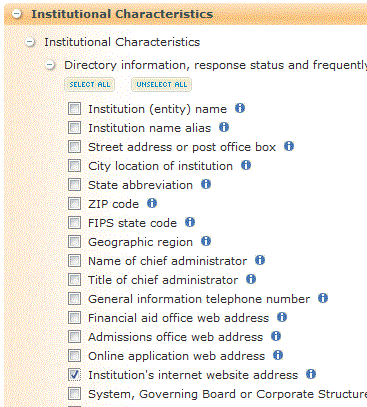 Now we are going to include a variable we didn’t use as a requirement to create our target group: the college’s web address. Have the website will save you a search for it. So Now we are going to include a variable we didn’t use as a requirement to create our target group: the college’s web address. Have the website will save you a search for it. Soselect the next orange header section “Institutional Characteristics” and check “Institution’s internet website address.” |
|
|
As you can see, there are plenty of other variables that we could select for our target group. But to keep things simple, let’s finish up and click on the blue “Continue” button.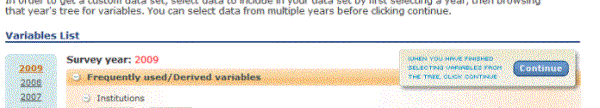 |
|
|
This screen shows us a summary of the variables we have chosen. The institution’s name is automatically included in the data. Since we’re happy with our current selections, click the blue “Continue” button.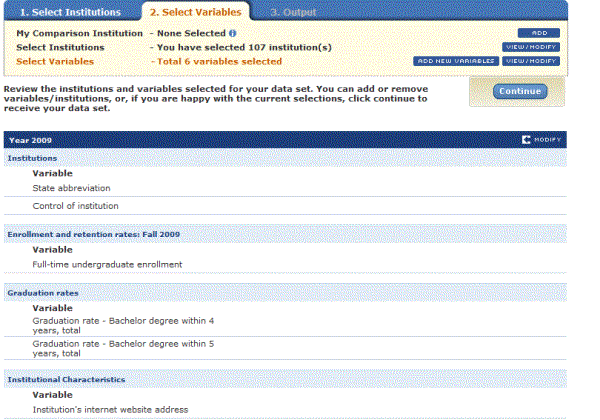 |
|
|
This provides a brief summary of our selected data and the down load option. Click on the download icon.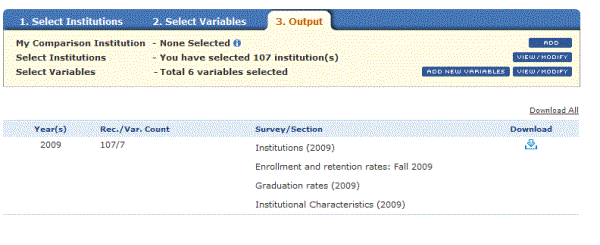 |
|
|
Select the CSV option to download the data. You will be downloading a zip file that contains a data file and a definition file.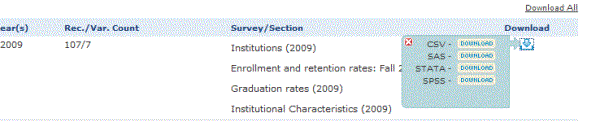 |
|
|
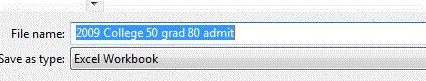
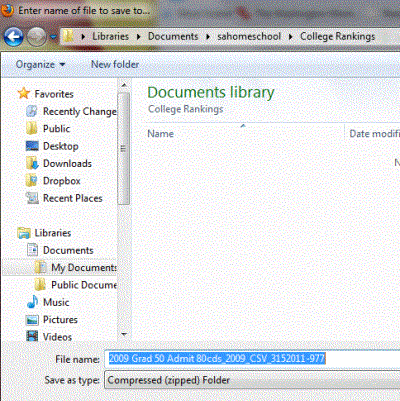 It’s a good idea to give the zip file a more meaningful name than the one provided. I find that using a description of the data requirements helps me to keep track of the various files. Use something that works for you. It’s a good idea to give the zip file a more meaningful name than the one provided. I find that using a description of the data requirements helps me to keep track of the various files. Use something that works for you. |
|
|
The zip file contains two files. One will be an Excel file with the data and the other an HTML file with the data definition.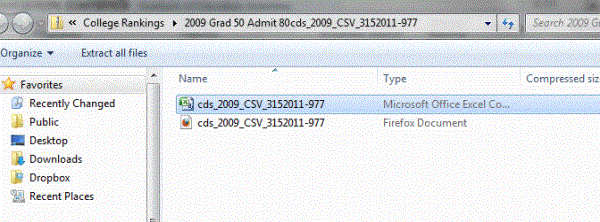 |
|
|
When you double click on the html file, it should open in your default browser, in my case Firefox. You will see a list of variables with their definitions, formats, and descriptive statistics. You’ll use this as a reference for deciphering any column headings in the Excel file.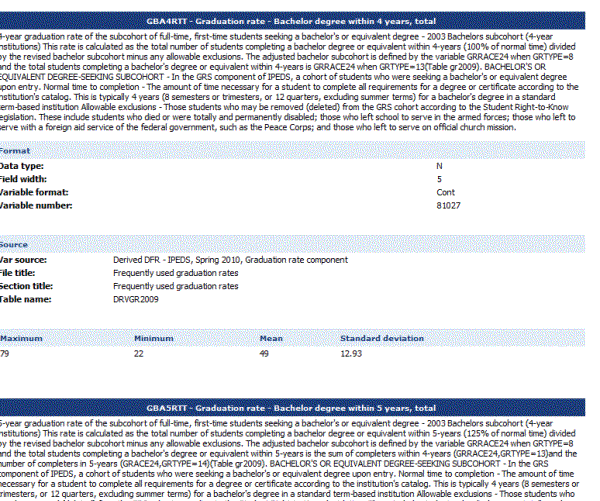 |
|
|
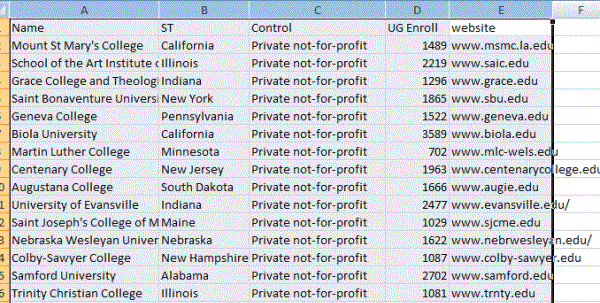
Your spreadsheet should resemble the one above. You probably won’t need to refer to the data definition file since the column headers are actually pretty descriptive.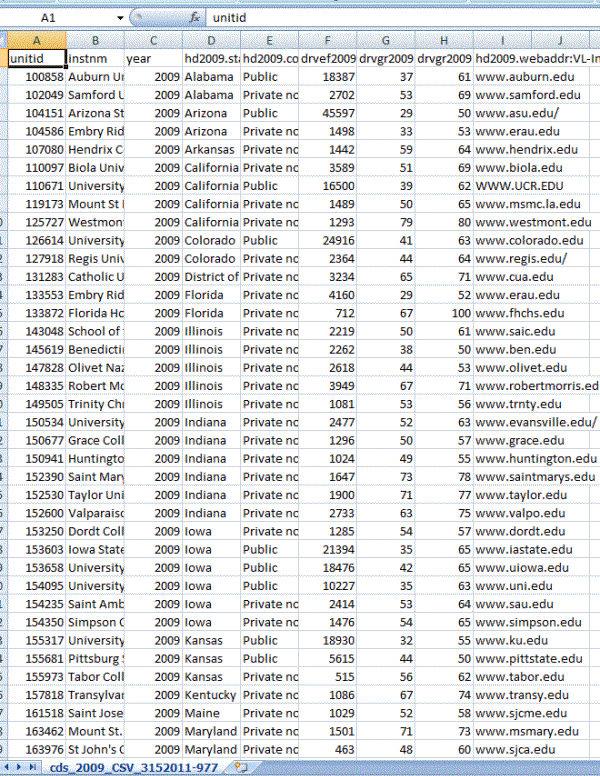 |
|
|
 I find it useful to create a new tab and copy all of the data into the new tab. I never work with the original data in the first tab, just my “work” data in the second tab and beyond. This way if I really screw up, I have the original data I can go back to. I find it useful to create a new tab and copy all of the data into the new tab. I never work with the original data in the first tab, just my “work” data in the second tab and beyond. This way if I really screw up, I have the original data I can go back to. |
|
|
 You need to save your file as an Excel file or whatever spreadsheet program you are using. You need to save your file as an Excel file or whatever spreadsheet program you are using. |
|
|
Now that you have you’re table saved, it’s time to give your columns some meaningful names. Actually, it’s more of a problem of shortening the existing name and allowing the text to wrap. Go ahead and change column widths as necessary to format and make the data easier to read.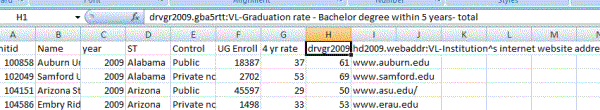 |
|
|
Create a new tab and copy your formatted data to it. We have to eliminate all the colleges with a four-year graduation less than 50%. Remember, we had to use the five-year rate to select the data since it was the only to accommodate allowing us to use the five-year rate for public schools and the four-year rate for private schools. We’re going to take care of this on this new tab.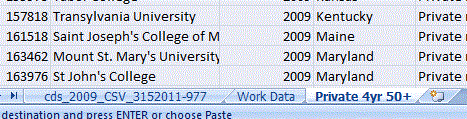 |
|
|
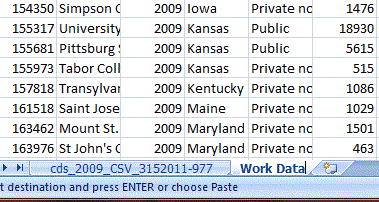
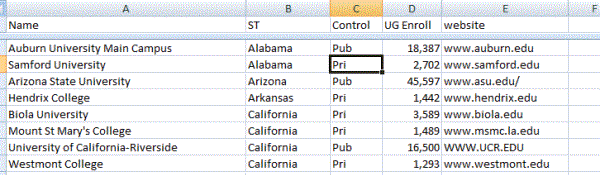
Sort your data on Institutional Control (Private or Public) and then on the four-year graduation rate.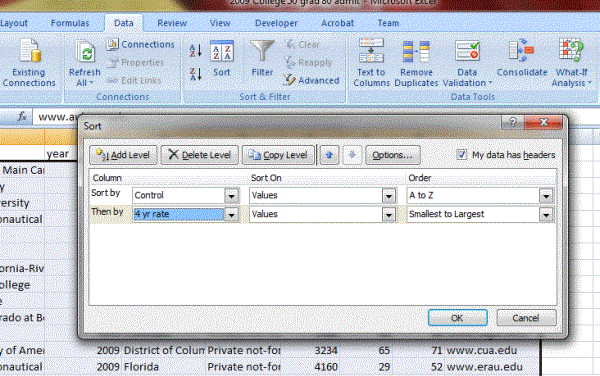 |
|
|
Delete the rows for all private schools with less than a 50 % graduation rate.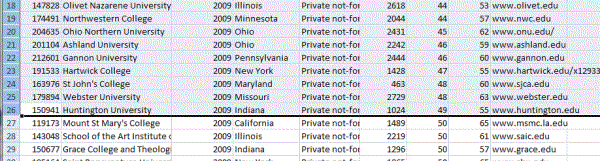 |
|
|
Create another tab to display your final data set |
|
Delete any columns that you no longer need. I deleted the unitid, year, and graduation rates.
|
|
|
I find the list more usable if I can look up schools by state so I sort the data by state and then by name.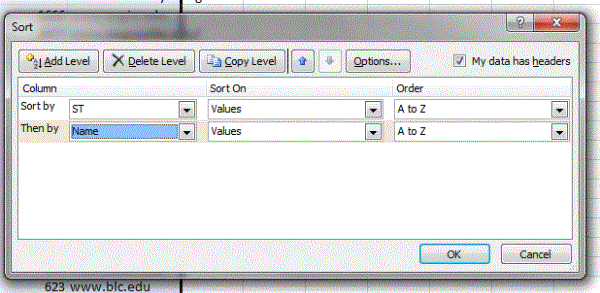 |
|
Ta-da! You have your final list of colleges! You can download the spreadsheet example of this process here.
|
| As stated in “And what about graduation rates?” this is a pretty limited list of colleges to work with. When you select your institutions, you probably don’t want to use graduation rates, or at least use a lower number to include more schools. You should always select the graduation rate as variable to display for the institution. Hopefully, this process shows you the wide variety of characteristics you can select for the institutions. If you want an already formatted Excel spreadsheet with the most useful available data, check out the DIY College Rankings Spreadsheet. |
6 thoughts on “A Simple Example of Creating a College Search List”