
 (Updated for 2019) Imagine choosing between two job offers. (I know, many would be grateful with just one but I did say imagine.) All other things being equal, you would pick the highest paying one, right? So if you’re deciding where to play D1 college baseball, all other things being equal, you would pick the one that spends the most money on the team.
Of course, all other things are never equal. There’s also the minor fact you have to have more than one baseball program wanting you on the team.
And then you have the issue of are you actually comparing apple to apples. Not exactly. Scholarships count for more at private colleges than at public ones. Programs that have to travel more, whether just for conference games or playoffs, will have higher expenses.
Finally, you have data errors. Not everyone is diligent in checking their data entry when submitting their information. So you never know if a school is really spending “that much” (or “only that much”) or if it’s a data entry error.
So which colleges spend the most on D1 Baseball?
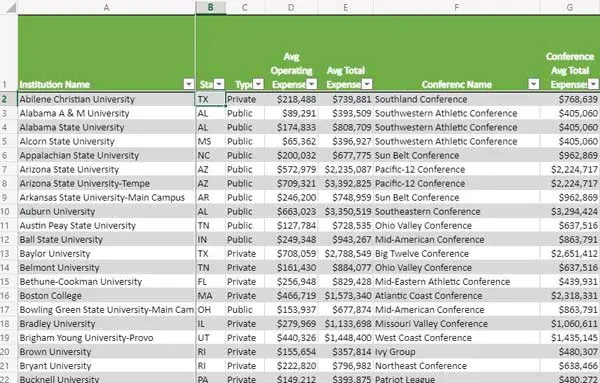
But just in case you’re still curious about how much colleges are spending on their baseball programs, the table below shows the average college baseball expenses for NCAA D1 programs for five years from 2013 to 2017.
LSU leads the list with an average of $5.7 million dollars. Three schools, Vanderbilt, TCU, and The University of Mississippi all have averages about $5 million. A total of 6 universities have averages in the $4 million range. Utah state had the lowest average of just $176,668.
- LSU-$5,796,848
- Vanderbilt University-$5,360,448
- Texas Christian University-$5,107,221
- University of Mississippi-$5,022,676
- The University of Texas at Austin -$4,673,763
- Florida State University-$4,648,873
- University of South Carolina-$4,513,115
- Texas A & M University-$4,100,980
- University of Arkansas-$4,036,687
- University of Florida-$4,035,535
However, this shows the limitation of the data. Utah State only has a club baseball team yet it’s listed as a D1 school in the Office of Postsecondary Education Equity in Athletics Data Analysis tool. I suspect the problem is that its extension campus does have a baseball team that competes at the JuCo level. Just another reminder about data errors. Otherwise, the lowest average belongs to Mississippi Valley State University with $214,102.
If you’re just looking at conferences, the SEC averages over 3.8 million dollars. The next closest conferences are the Big 12, coming in at $3.1 million, the ACC at $2.6 million, and the PAC-12 at $2.5 million. There are 10 conferences that average over a million dollars in expenses. Two conferences average less than 500,000 with the Mid-Eastern Athletic Conference averaging $470,144 and the Southwestern Athletic Conference averaging the lowest as $439,078.
- Southeastern Conference-$3,840,034
- Big 12 Conference-$3,192,789
- Atlantic Coast Conference-$2,699,656
- Pac-12 Conference-$2,571,834
- Big Ten Conference-$1,920,451
- American Athletic Conference-$1,649,352
- West Coast Conference-$1,588,075
- Big West Conference-$1,367,147
- Mountain West Conference-$1,320,410
- Conference USA-$1,225,674
- Big East Conference-$1,219,567
- ASUN Conference-$1,122,439
- Colonial Athletic Association-$1,100,765
- Sun Belt Conference-$1,006,434
Exactly what’s included in expenses
The table shows two numbers-Operating Expenses and All Expenses. Operating expenses covers only “Game Day” expenses. These are expenses
attributable to home, away, and neutral-site intercollegiate athletic contests (commonly known as game-day expenses), for (A) Lodging, meals, transportation, uniforms, and equipment for coaches, team members, support staff (including, but not limited to team managers and trainers), and others; and (B) Officials.
All expenses are
attributable to intercollegiate athletic activities. This includes appearance guarantees and options, athletically related student aid, contract services, equipment, fundraising activities, operating expenses, promotional activities, recruiting expenses, salaries and benefits, supplies, travel, and any other expenses attributable to intercollegiate athletic activities.
Again, the following college baseball expenses data from the Office of Postsecondary Education(OPE) will have the issues I mentioned earlier. Or as OPE states in its cautionary note “Please note that valid comparisons of athletics data are possible only with study and analysis of the conditions affecting each institution.”
Average D1 College Baseball Expenses for 2013-2017
(Latest Data Available Here)
2 thoughts on “How Much do D1 Colleges Spend on Baseball Programs?”